
Expert Preclinical Science — Biotech Farm Ltd.
Preclinical Data Analysis and Statistics: Turning Animal Study Numbers into Reliable Decisions
At the intersection of preclinical R&D and regulatory readiness, robust statistical analysis is what transforms raw animal study data into defensible scientific conclusions. Small sample sizes, biological variability, and repeated measures make preclinical datasets unlike any standard business or clinical dataset. This article walks through how professional animal study statistics, nonclinical data analysis, and preclinical report writing should be executed — from data reception to a submission-ready report — while keeping transparency, reproducibility, and ethical standards at the core.
Biostatistics
Regulatory Reporting
3Rs Compliance
🔎 Expert Insight
Preclinical datasets are biologically complex, ethically constrained, and regulatory-facing. Choosing the wrong statistical method or mishandling missing data here does not just waste a study — it can delay an entire development program. The analytical decisions made before the first animal is enrolled matter as much as those made after the data arrive.
Why Is Animal Study Statistics Different from “Regular” Analysis?
Animal study statistics operates under constraints that most conventional analytics never encounter. Sample sizes are intentionally small for ethical reasons, biological variability between individuals is high, endpoints are often measured repeatedly across time, and mortality or withdrawal events can distort naive comparisons. Add operational biases — cage effects, order of dosing, technician handling — and it becomes clear that generic tests such as a plain t-test are rarely appropriate. Proper nonclinical data analysis requires specialized models (mixed-effects, survival, non-parametric) and experimental designs that anticipate these constraints from day one, so that study data interpretation remains valid even with limited N.
⚠ Common Errors Leading to Wrong Conclusions
- Misreading biological variability as noise
- Ignoring within-subject correlation in repeated measures
- Pooling technical replicates as independent animals
- Running many tests without multiplicity correction
✓ Reducing Bias from the Planning Phase
- Randomized allocation before first enrollment
- Blinded outcome assessment
- Pre-specified endpoints and statistical analysis plan
- NC3Rs Experimental Design Assistant for rigorous planning
What Does a Proper Nonclinical Data Analysis Workflow Look Like?
A defensible nonclinical data analysis workflow follows a sequential, documented path. It begins with a careful reading of the study protocol and the pre-defined primary and secondary endpoints — the analysis must serve the science, not the other way around. Data then undergo quality control and cleaning, followed by application of statistical methods matched to the design. Finally, results are interpreted in biological context and delivered in a structured report with tables, graphs, and a discussion that ties findings back to the research question. Every decision is traceable, so that another statistician could reproduce the same output from the same raw file.
Data QC and Cleaning
A data dictionary is defined: variable names, units, expected ranges, and coding for categorical values. Consistency checks flag impossible values, duplicated animal IDs, or timepoint mismatches. Missing data are catalogued with reasons, not silently dropped. Every cleaning decision is logged for full reproducibility.
Statistical Analysis and Documentation
The right method is selected based on data structure and endpoint type, not habit. Code, seeds, software versions, and model specifications are all documented so that reruns produce identical outputs and reviewers can fully audit the reasoning.
Interpretation and Presentation
Numbers alone are not conclusions. Effect sizes, confidence intervals, and biological plausibility are combined into a narrative supported by clean tables and clear graphs — each figure captioned so a reader can understand it without hunting through the text.
Which Types of Preclinical Data Get Analyzed in Practice?
Preclinical programs generate diverse data streams, and each needs a tailored analytical approach matched to the animal model and research question. Because Biotech Farm supports large animal models (pig, sheep, goat, rabbit) alongside classical rodent work, the analytical toolbox is chosen to fit the biological reality of the species and the endpoint, rather than forcing every dataset through the same template.
| Data Type | Typical Examples | Common Analytical Approach |
|---|---|---|
| Efficacy | Tumor volume, wound closure, lesion score | Mixed models, ANCOVA on baseline |
| Safety / Toxicology | Clinical chemistry, hematology, organ weights | Group comparisons with multiplicity control |
| PK / PD | Concentration-time profiles, exposure-response | Non-compartmental or compartmental modeling |
| Clinical Pathology | Biomarkers, histopathology scores | Non-parametric tests, ordinal regression |
| Behavioral / Physiological | Locomotor activity, ECG, body weight | Repeated-measures mixed models |
| Survival | Time-to-event, mortality | Kaplan–Meier, Cox regression |
Choosing the Right Statistical Test in Preclinical Research
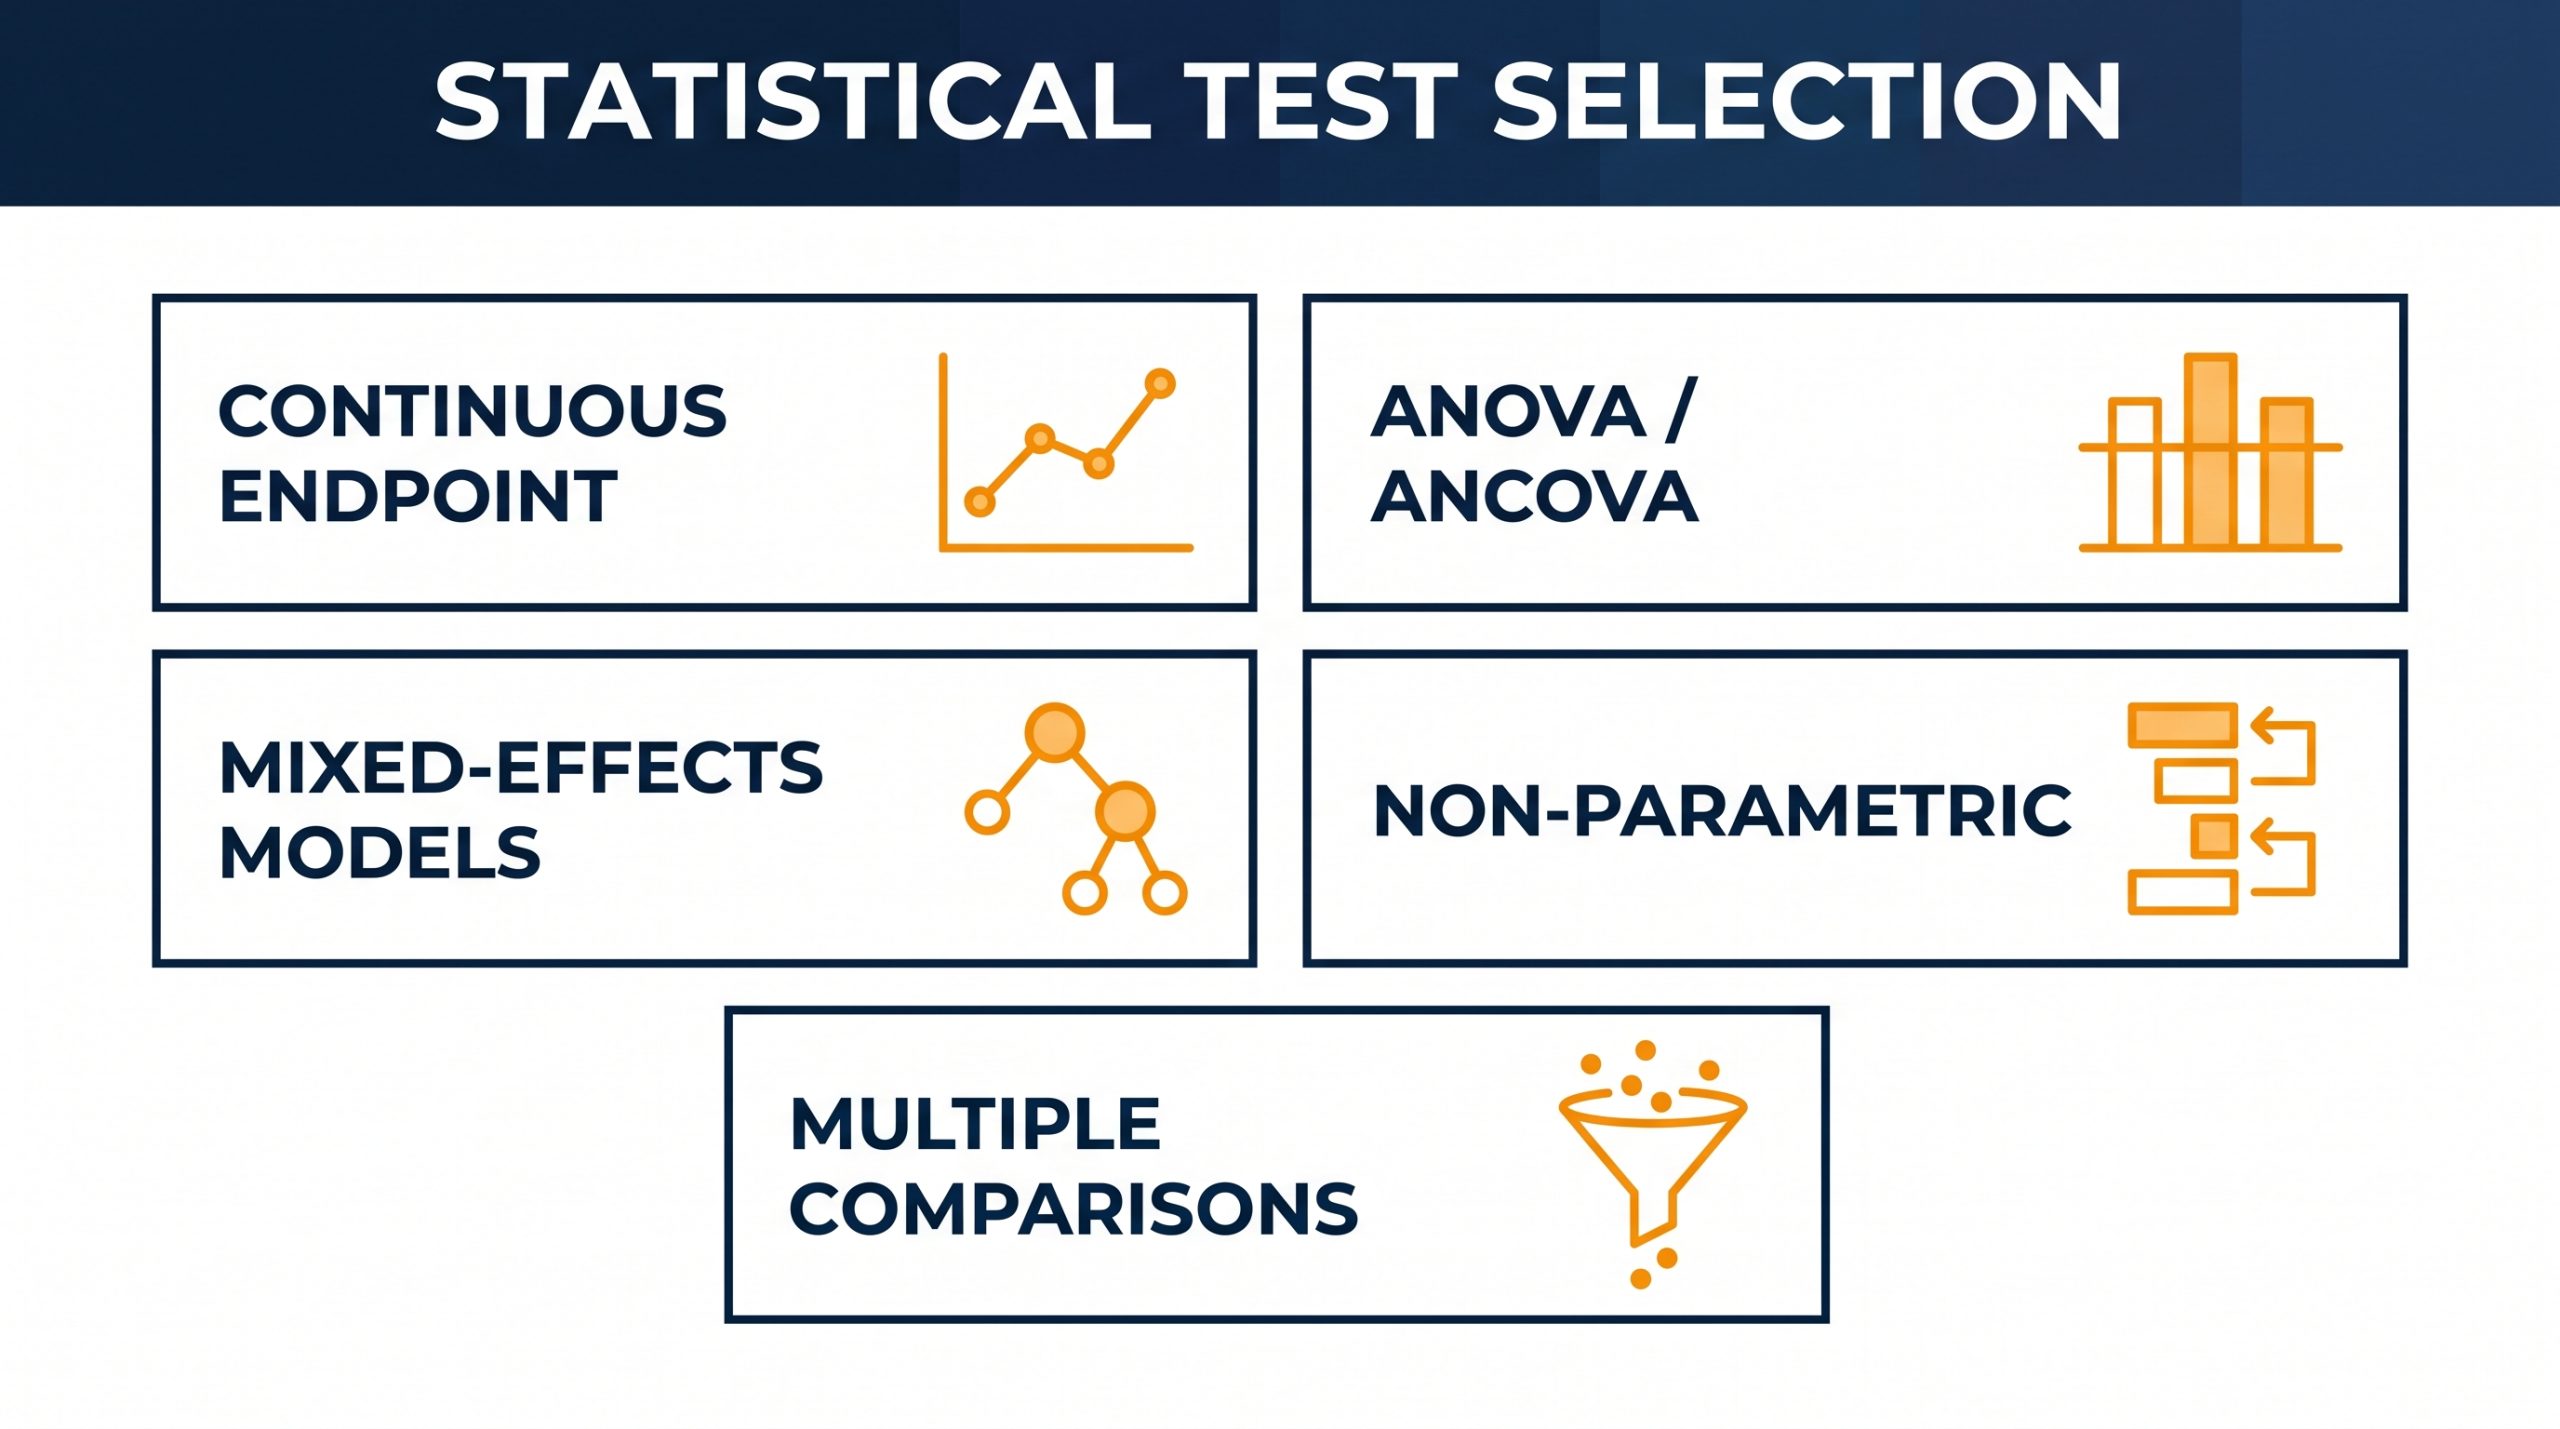
Test selection is a design decision, not a reflex. The choice depends on whether the endpoint is continuous or categorical, how many groups are compared, whether measurements are independent or repeated, and whether model assumptions (normality, homoscedasticity) are met. The common preclinical toolkit includes ANOVA and ANCOVA for group comparisons with baseline adjustment, mixed-effects models for repeated measures, non-parametric alternatives (Mann–Whitney, Kruskal–Wallis) when distributions are skewed or N is very small, regression for dose-response, and multiple-comparison corrections such as Tukey, Dunnett, or Benjamini–Hochberg to control error rates across families of tests.
Repeated Measures — Why Mixed Models Win
Mixed-effects models handle within-animal correlation directly, tolerate missing timepoints without discarding whole animals, and separate fixed treatment effects from random subject variability. For longitudinal studies with weekly measurements, they typically deliver more accurate estimates than repeated t-tests or naive ANOVA on wide-format data.
Multiple Comparisons — How Not to “Create” Significance
Running many tests on the same dataset without adjustment inflates the false-positive rate rapidly. Pre-specifying the primary endpoint, grouping tests into families, and applying an appropriate correction preserves interpretability. Post-hoc exploratory findings are reported honestly as hypothesis-generating rather than confirmatory.
“The choice of statistical method should be made before the data are seen — and that choice should be documented and justified in the analysis plan, not reverse-engineered from a favorable p-value.”
— Biotech Farm Statistical Methodology Standard
Analyzing Survival Data (Kaplan–Meier) in Animal Studies
Survival analysis is required whenever the endpoint is time to an event — death, tumor progression, humane endpoint, or device failure. Kaplan–Meier curves visualize survival probability over time for each group, and log-rank tests compare them formally. What separates a rigorous analysis from a misleading one is the handling of censoring: animals removed for reasons unrelated to the event (technical loss, end of observation) must be censored, not counted as events.
✓ Best Practice for Survival Analysis
- Lock event definitions, dates, and censoring reasons before unblinding
- Report hazard ratios from Cox model alongside KM curves
- Include median survival times with confidence intervals
- Report number at risk below curves at each time interval
When Animals Do Not All Survive or Data Go Missing
Missing data are a fact of preclinical life, and the way they are handled can silently drive the conclusion. Inclusion and exclusion rules must be defined upfront in the protocol — not chosen after seeing results. Every missing value should be documented with its reason: humane endpoint, technical failure, sampling issue.
⚠ Missing Data Mechanisms — Why They Matter
- MCAR (Missing Completely at Random) — Least biased; simpler methods may apply
- MAR (Missing at Random) — Requires model-based approaches such as mixed models
- MNAR (Missing Not at Random) — Most complex; sensitivity analyses mandatory
- Aggressive imputation without justification introduces undetectable bias
Calculating Sample Size Reasonably for a Preclinical Study
Sample size is both a statistical and an ethical question. A power analysis estimates the minimum number of animals needed to detect a biologically meaningful effect with acceptable Type I and Type II error rates, based on expected effect size, expected variability, number of groups and timepoints, and planned attrition. Under-powering wastes animals and money on an inconclusive study; over-powering wastes animals unnecessarily. Both violate the 3Rs.
Common Errors in N Calculation
- Using a wildly optimistic effect size to justify a smaller N
- Ignoring expected mortality or dropout rate
- Confusing technical replicates with biological replicates
- Failing to inflate N for multiple endpoints or multiple timepoints
- Not documenting the assumptions behind the calculation
What Does Preclinical Report Writing Include?
Excellent preclinical report writing is not just a formatted document — it is the transparent bridge between raw data and a scientific or regulatory decision. A good report opens with clear objectives and hypotheses, describes methods in enough detail for another lab to reproduce the work, presents results with tables and figures that stand alone, and closes with an interpretive discussion that connects findings back to the research question. The ARRIVE Guidelines 2.0 provide the current international standard for what should be reported.
📑 Recommended Report Chapter Structure
- Title page and study identifiers
- Objectives and hypotheses
- Regulatory and ethical statements
- Materials (test article, animals, husbandry)
- Methods (design, randomization, blinding, endpoints, statistical plan)
- Results with tables and figures
- Discussion and interpretation; conclusions
- Protocol deviations and appendices (raw data, code, audit trail)
✓ Quality Checklist Before Delivery
- Numbers in text match tables (internal consistency)
- Completeness against the original protocol
- Effect sizes, confidence intervals, and exact p-values reported
- All figures legible and self-explanatory
- Full traceability of every result to a source dataset
- ARRIVE 2.0 checklist review completed
Study Data Interpretation Without “Beautifying” Results
Professional interpretation is built on transparency, not narrative convenience. That means reporting effect sizes and their uncertainty, not just p-values; disclosing outliers and how they were handled; naming the limitations of the model rather than hiding them; and clearly labeling confirmatory findings versus exploratory or post-hoc observations. When results are ambiguous, alternative interpretations and sensitivity analyses are presented side by side. The goal is a report a sponsor, an ethics committee, and a regulator can each trust for their own purpose. This aligns with NIH principles on rigor and transparency in preclinical research.
“A p-value of 0.049 and a p-value of 0.051 are not meaningfully different — but they are often treated as night and day. Effect sizes and confidence intervals tell the real story.”
— Biotech Farm Scientific Interpretation Principles
Nonclinical Data Analysis vs. Data Management: What Is the Difference?
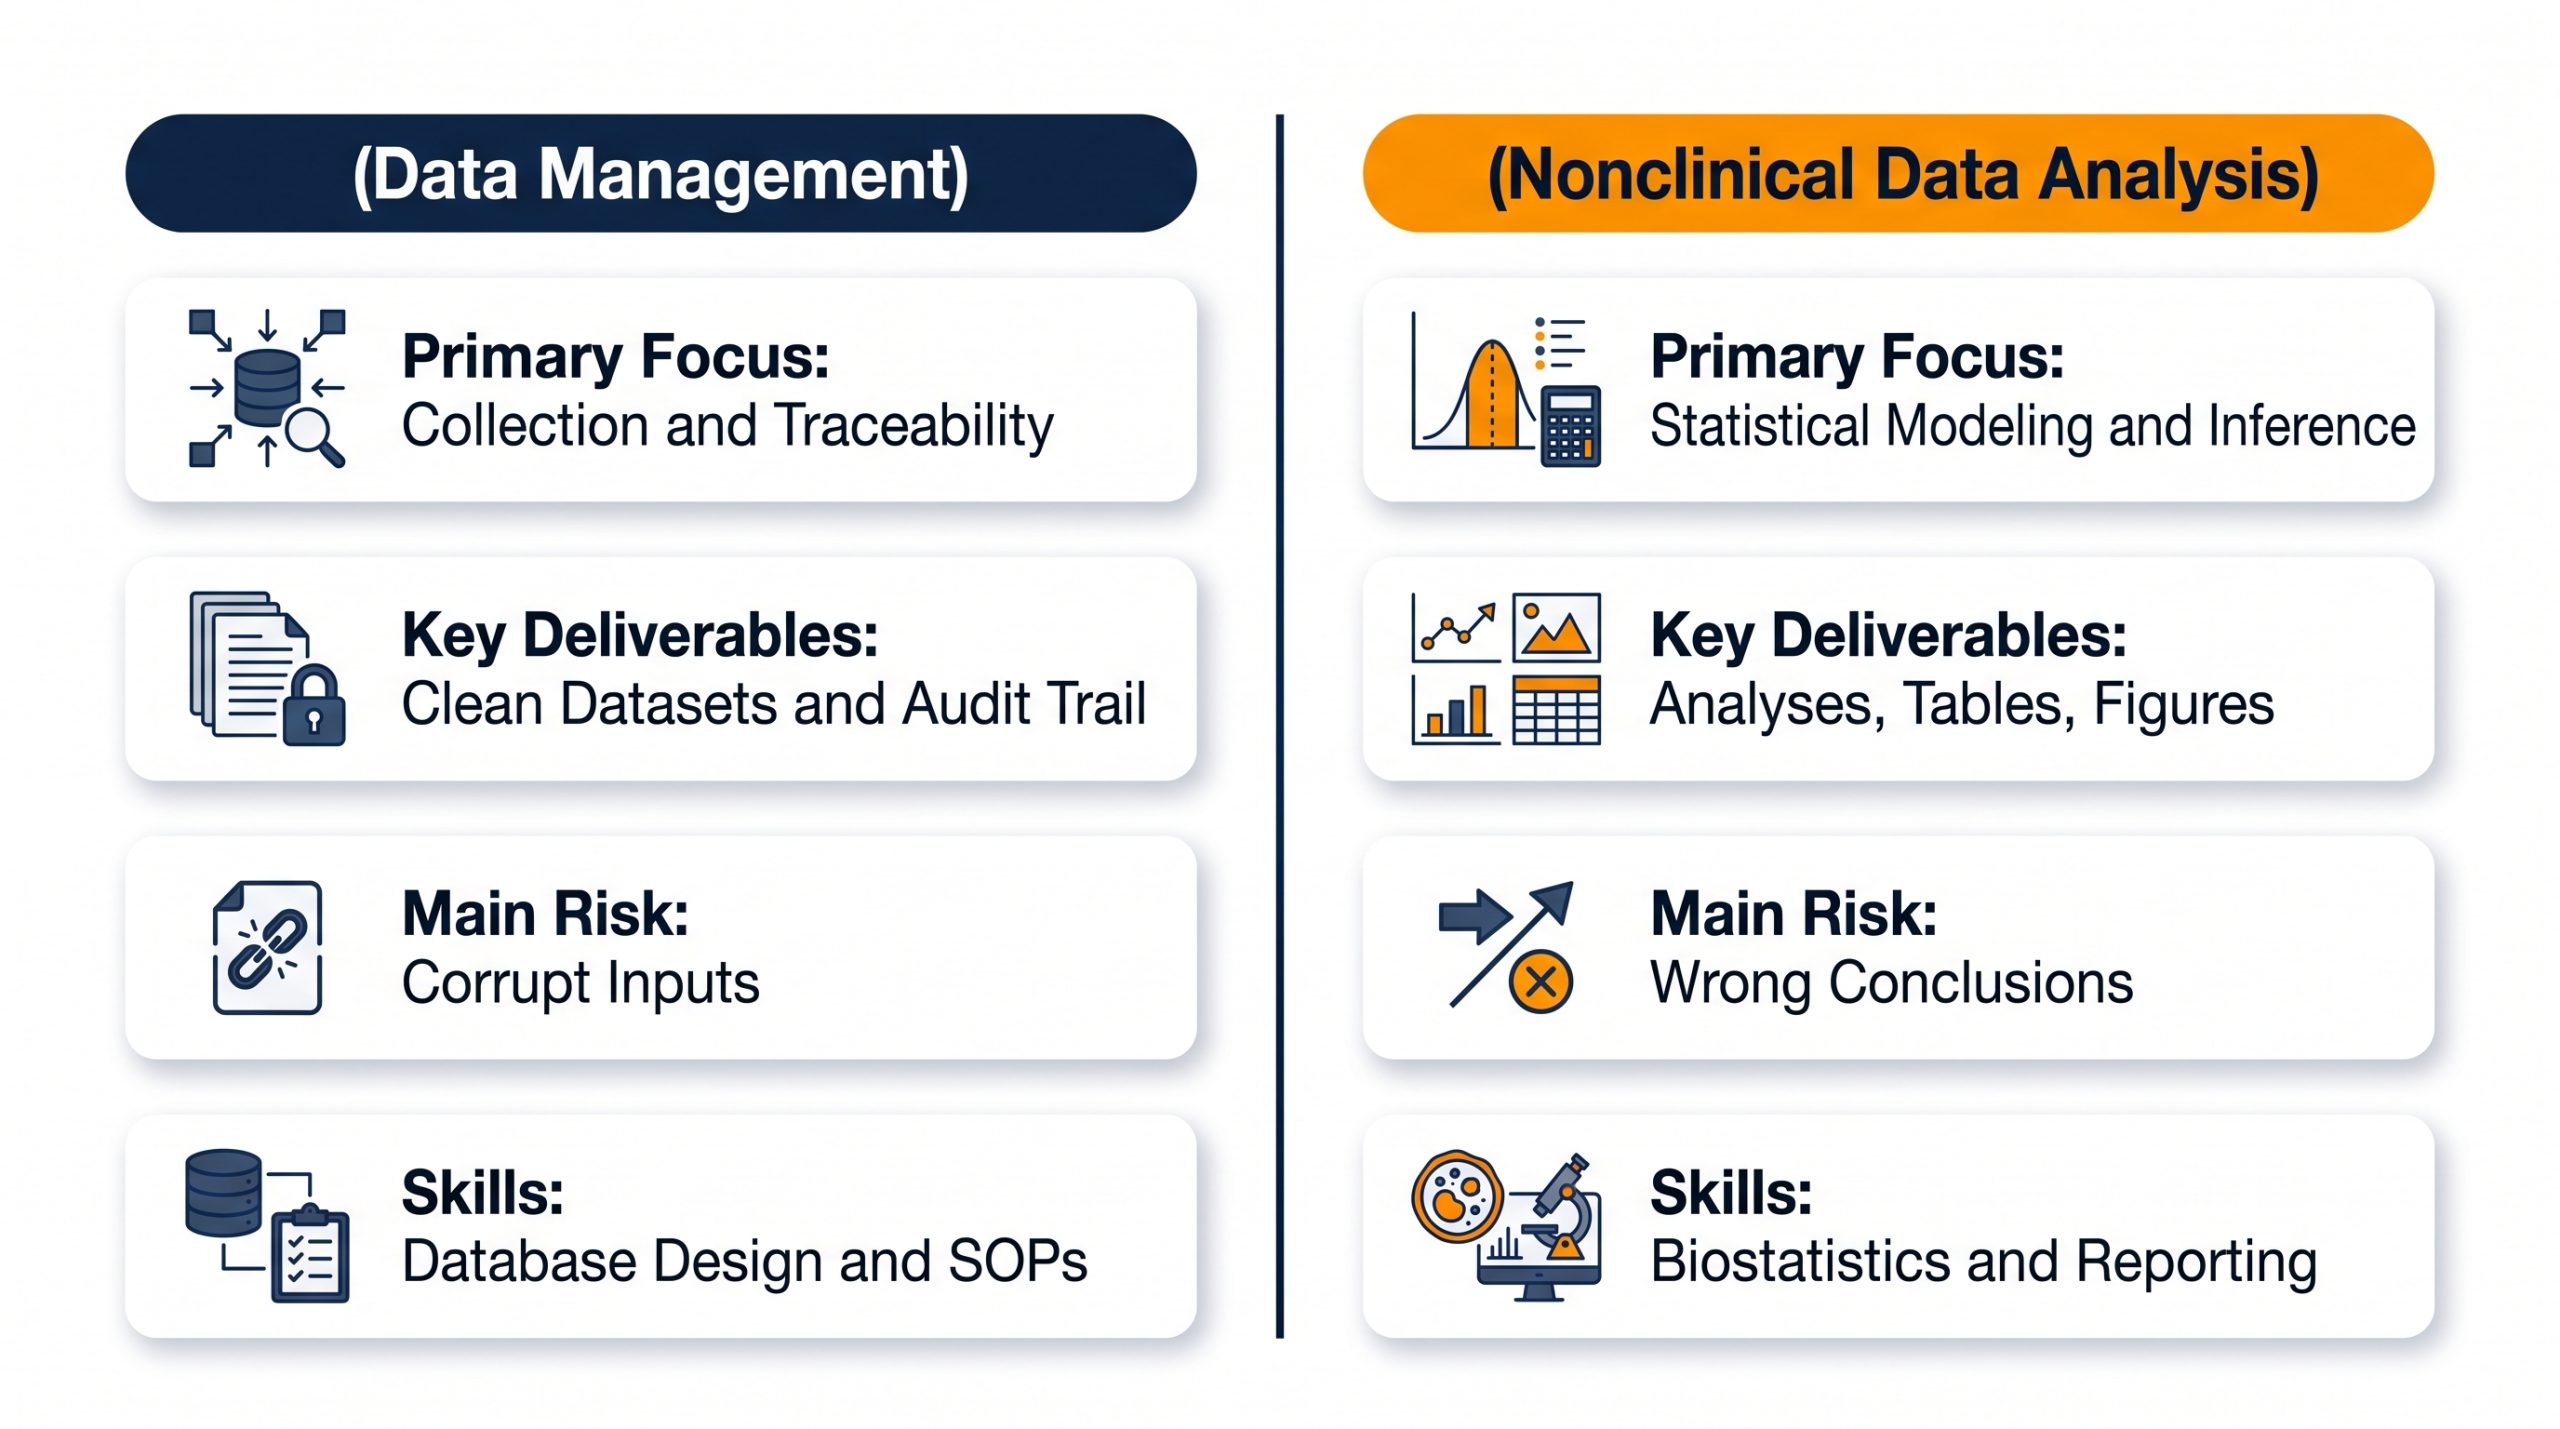
These two disciplines are often confused, yet they are distinct and complementary. Weak data management poisons even the best statistical analysis; strong data management without competent analysis produces tidy files that never become decisions. Both must operate together for reliable, defensible outputs.
| Aspect | Data Management | Nonclinical Data Analysis |
|---|---|---|
| Primary Focus | Collection, standardization, traceability | Statistical modeling and inference |
| Key Deliverables | Clean datasets, data dictionaries, audit trail | Analyses, tables, figures, interpretation |
| Main Risk if Weak | Corrupt inputs propagate through analysis | Clean data but wrong or unusable conclusions |
| Core Skills | Database design, SOPs, QC | Biostatistics, domain biology, reporting |
How the Biotech Farm Approach Supports the Analysis Lifecycle
Beyond running a facility for large-animal preclinical work, the added value of an integrated partner is that study design, in-life execution, data capture, and analysis are all coordinated under one scientific team. Protocols are written with endpoints and analysis plans defined upfront, data are captured in structured formats from day one, and reports are prepared with regulatory context in mind. This tight coupling reduces rework, shortens timelines, and produces documentation aligned with international expectations for preclinical evidence.
| Business Need | How the Integrated Approach Supports It |
|---|---|
| Study design that avoids under-powering | Upfront power analysis and endpoint definition tied to the statistical plan |
| Data ready for regulatory review | Structured capture, documented cleaning, traceable analyses aligned with ARRIVE and GLP principles |
| Complex large-animal models | Experience with pig, sheep, goat, and rabbit models across cardiology, orthopedics, ophthalmology, and more |
| Reproducible reporting | Locked analysis code, version-controlled outputs, QC checklists before delivery |
| Ethical compliance | 3Rs-driven design, animal welfare embedded in every protocol |
Sponsors working on medical devices, pharmaceuticals, and biologicals gain a single point of scientific accountability from design through report, which shortens the loop between question and evidence. See the broader context of preclinical animal studies and available animal models for typical program structures.
Timelines, Costs, and How to Get an Accurate Quote
⏱ Realistic Analysis Timelines
Timelines range from a few days for a compact pilot to several weeks for a complex GLP-style toxicology or efficacy study with multiple endpoints. Duration depends on data volume, number of endpoints, statistical complexity, number of review cycles, and the state of incoming data. When organized raw data, protocol, and statistical plan are ready, delivery is fast and predictable.
💲 What Drives the Cost
- Study complexity (species, groups, timepoints, endpoint variety)
- Condition of incoming data (structured vs. needs reconstruction)
- Scope of deliverable (internal memo vs. submission-ready report)
- Urgency and number of review cycles required
📝 How to Get an Accurate Quote
Share the study protocol, a description of the dataset (number of animals, endpoints, timepoints, file formats), and the desired outputs (report type, target audience, regulatory context). The clearer the inputs, the tighter the quote — and the faster the delivery.
Frequently Asked Questions
Ready to Turn Your Preclinical Data into Decisions You Can Defend?
Whether you are designing a new large-animal study, sitting on datasets waiting for rigorous analysis, or preparing a report for regulatory submission, a coordinated scientific partner can accelerate your program significantly.