Sample Size Calculation in Preclinical Studies: A Scientific and Ethical Framework
At the heart of every rigorous preclinical study lies a question that is often underestimated: how many animals are truly needed? Sample size calculation is not a bureaucratic checkbox but a scientific discipline that shapes the validity, reproducibility, and ethical footprint of animal research. At Biotech Farm, planning group sizes is treated as a foundational element of protocol design, integrating statistical logic with the 3Rs principle and regulatory expectations for large animal preclinical research.
A statistically underpowered preclinical study doesn’t just fail scientifically — it also fails ethically. Every animal used in a study that cannot detect its target effect represents an avoidable cost. Rigorous sample size justification is the single intervention that simultaneously protects scientific validity, satisfies regulatory requirements, and upholds animal welfare. There is no shortcut that serves all three.
Why is Sample Size Calculation Essential in Preclinical Research?
A well-justified animal number calculation is the cornerstone of scientific integrity in preclinical work. Underpowered studies risk missing true biological effects, generating inconclusive data that waste animal lives and financial resources. Overpowered studies, on the other hand, expose more animals than necessary to procedures, conflicting with ethical mandates.
Institutional and ethics committees, including IACUC-equivalent bodies, typically require a formal statistical justification for the number of animals proposed, as reflected in institutional research proposal guidelines. In Israel, the legal framework established by the Animal Welfare (Animal Experimentation) Act further emphasizes minimizing suffering and avoiding unnecessary use of animals, aligning statistical rigor with legal obligation.
Miss real biological effects. Animals are used without producing scientifically valid conclusions — ethically unjustifiable.
Expose more animals than scientifically necessary. This violates the Reduction principle of the 3Rs and faces ethical committee scrutiny.
Use the minimum number of animals needed to achieve reliable conclusions — balancing science, ethics, and regulatory compliance perfectly.
Where Does Sample Size Fit Within the 3Rs Framework?
The 3Rs — Replacement, Reduction, and Refinement — are not abstract ethical slogans but operational principles. Proper sample size calculation directly serves the Reduction pillar: using the minimum number of animals required to obtain scientifically valid conclusions.
Eliminates the need for animal numbers where feasible. Where replacement is possible, the sample size question becomes moot — but this requires validated alternatives.
Directly served by sample size calculation. Using the minimum number compatible with valid results — never fewer (underpowered), never more (unnecessary exposure).
Better housing, handling, and procedures reduce biological variability — which improves power and can therefore reduce N indirectly.
A study that uses too few animals is not ethical simply because it uses fewer. If it cannot answer the scientific question, all animals used were wasted — representing both a moral failure and a scientific one.
Step-by-Step Guide to Calculating Sample Size for Preclinical Studies
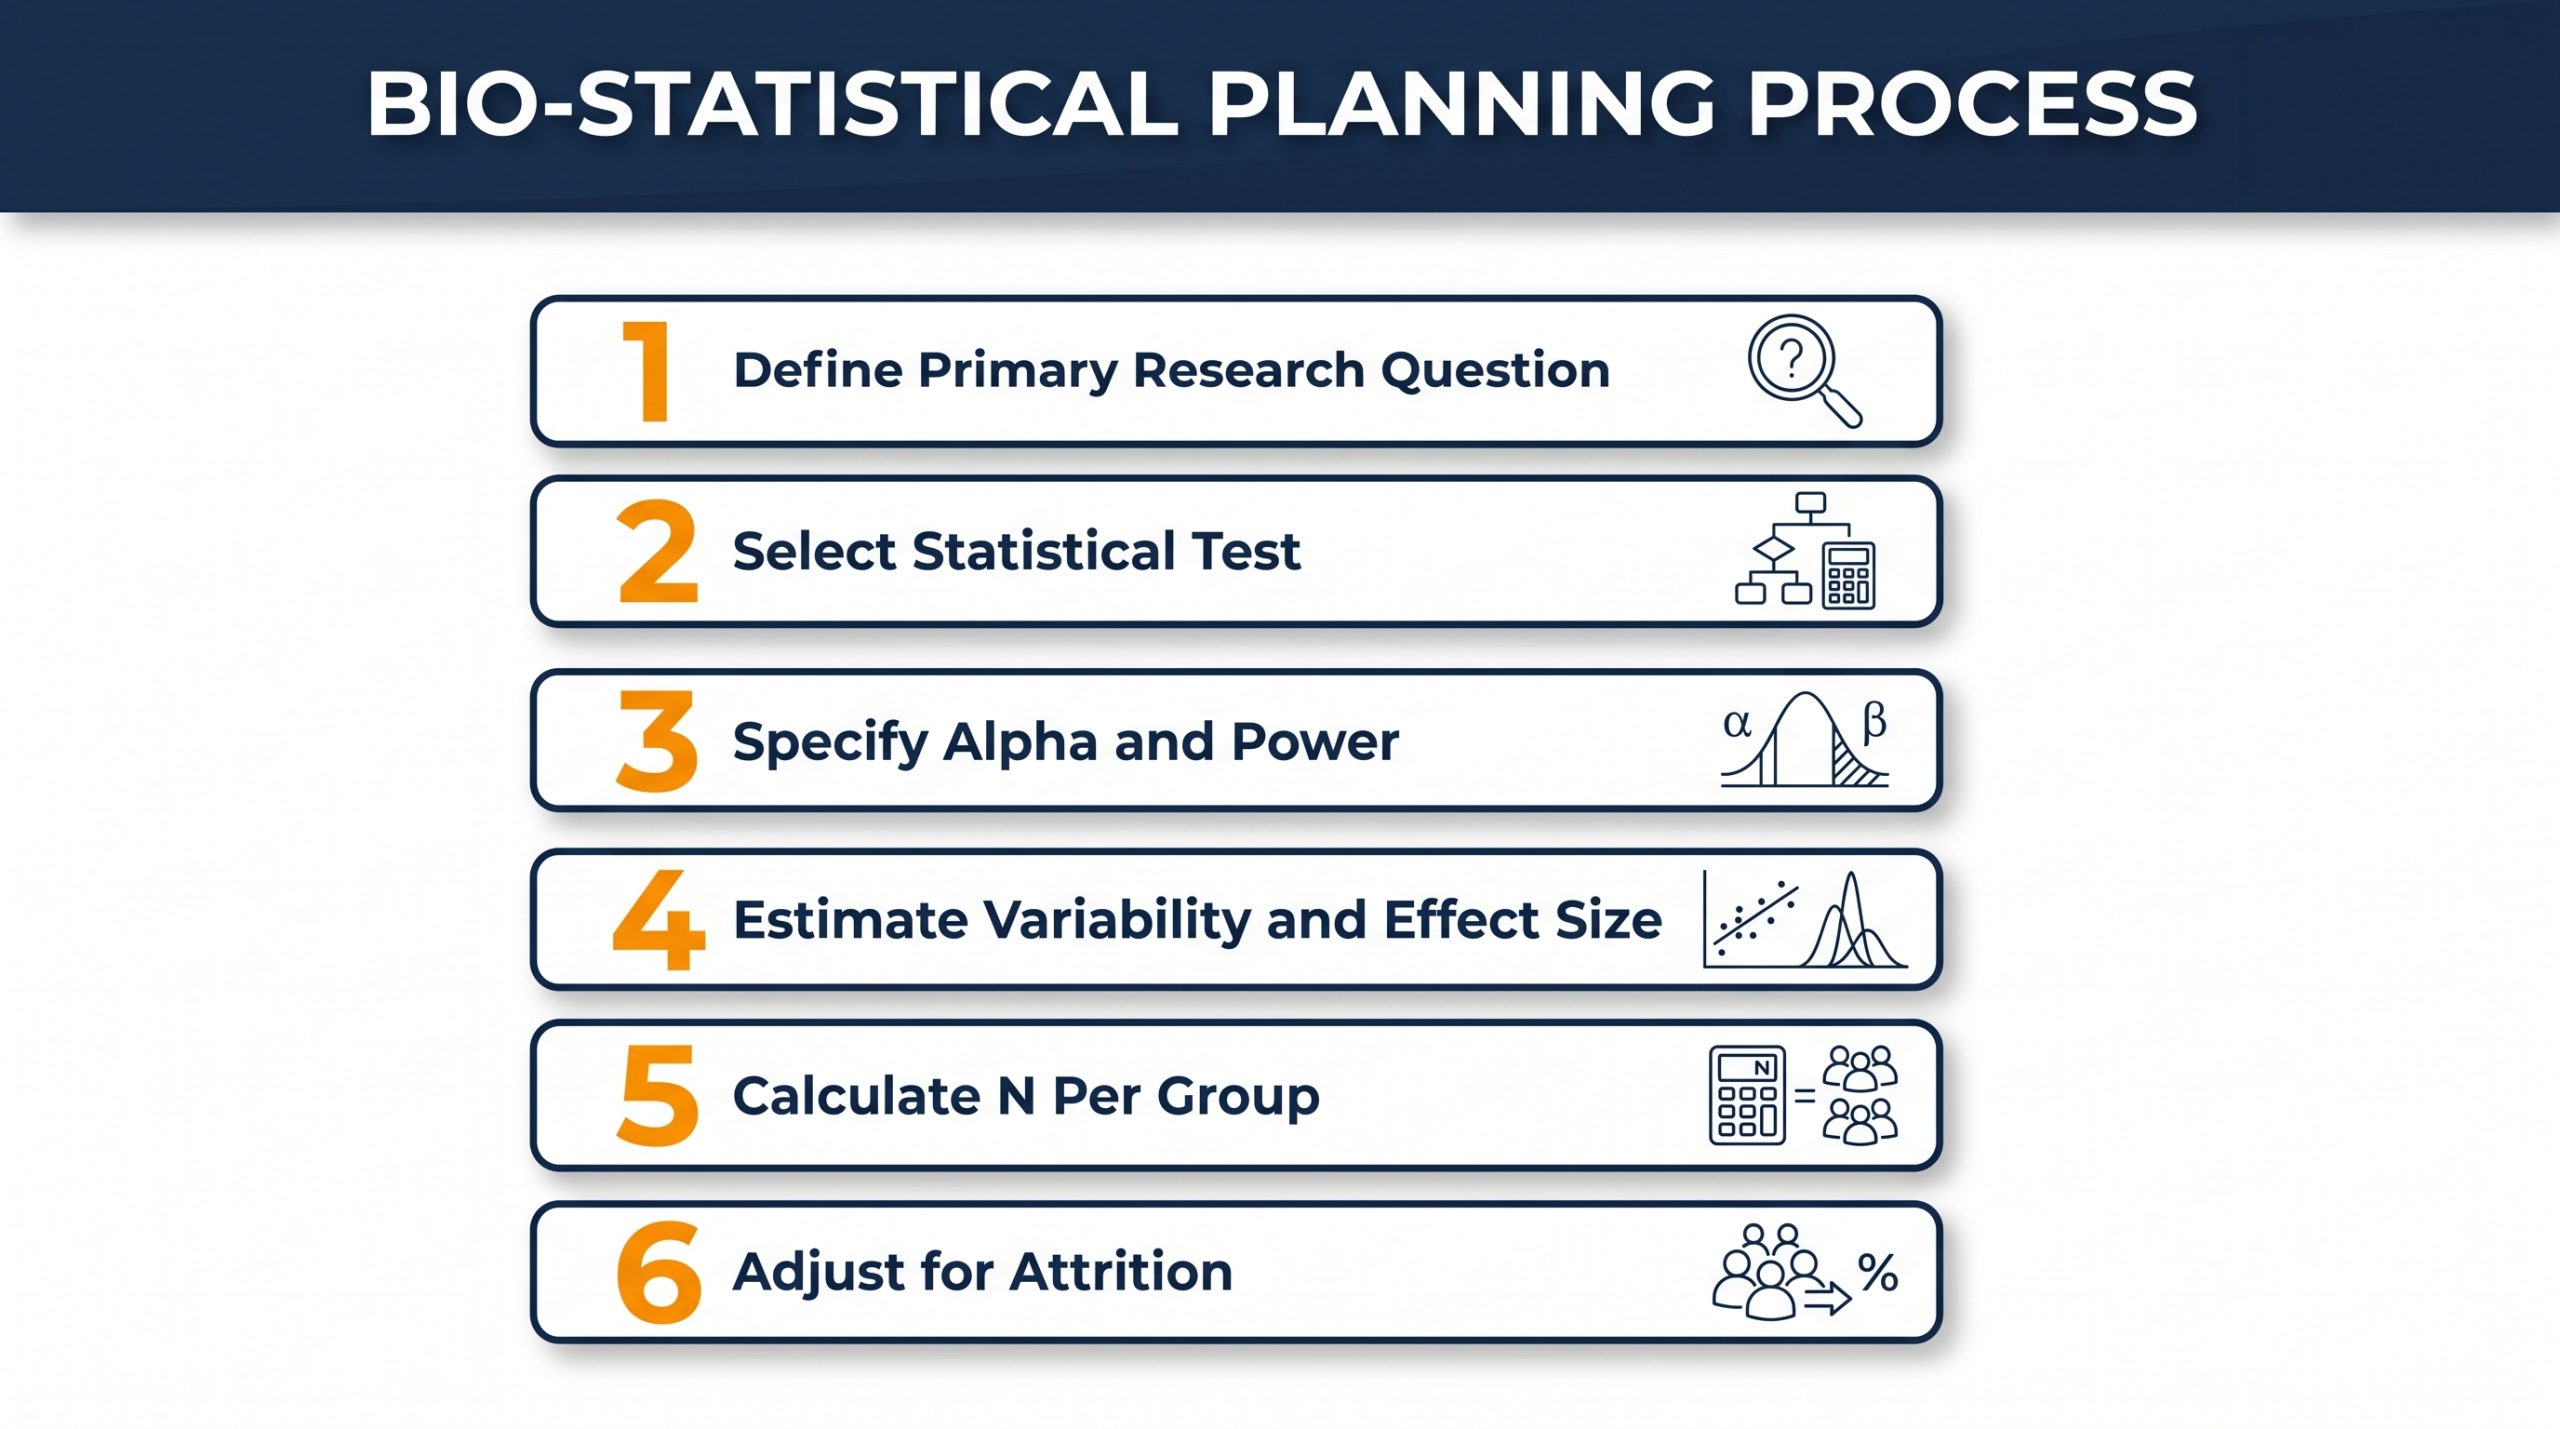
A structured sequence protects the sample size calculation preclinical study from arbitrary decisions. Each step must be documented so that reviewers can reconstruct the logic behind the final group size animal study.
The 7-Step Calculation Process
-
1
Define the primary research question and its measurable outcome. -
2
Select the statistical test that matches the outcome type and study design. -
3
Specify alpha (α = 0.05) and target power (usually ≥ 0.80). -
4
Estimate variability (SD) using pilot data, published studies, or expert consensus. -
5
Choose a biologically meaningful effect size tied to translational relevance. -
6
Calculate n per group using an appropriate formula or validated software. -
7
Adjust upward for expected attrition, mortality, or multiple comparisons.
Pre-Calculation Checklist: Essential Inputs
Before opening any calculator, gather all required inputs. Missing even one of these turns a rigorous calculation into guesswork:
- Primary outcome measure and its scale (continuous, binary, ordinal)
- The true experimental unit (individual animal, cage, or litter)
- Number of experimental groups
- Hypothesis direction (one- or two-tailed)
- Estimated standard deviation or event rate
- Anticipated attrition and dropout rates
What is Statistical Power and Why is it Critical for Animal Numbers?
Statistical power is the probability of detecting a real effect if it truly exists in the population. Low statistical power preclinical studies inflate the risk of Type II errors — false negatives — which means genuine biological effects are missed and animals were used without scientific yield.
Power is driven primarily by three levers:
Increasing n directly raises power. The relationship is non-linear — doubling n does not double power.
Larger biological effects are easier to detect with smaller samples. Smaller effects demand larger n.
Decreasing outcome variability raises power. Standardized procedures, blinding, and genetic homogeneity all help.
Demystifying Key Statistical Terms: α, β, Power, and p-value
A common confusion is treating the p-value as a measure of power. It is not — and understanding this distinction is essential for sound protocol design.
| Term | Definition | When Set |
|---|---|---|
| α (Alpha) | Probability of a Type I error (false positive) — rejecting a true null hypothesis. Typically set at 0.05. | Before the experiment |
| β (Beta) | Probability of a Type II error (false negative) — failing to reject a false null hypothesis. | Before the experiment |
| Power (1−β) | Probability of correctly detecting a real effect. Minimum target: 0.80 (80%). | Before the experiment |
| p-value | Post-hoc statistic reflecting observed evidence against the null hypothesis. NOT a measure of power. | After data collection |
“Building a study design around an intended p-value rather than a pre-specified power is a frequent source of flawed protocols — and a recurring reason ethical committees return submissions for revision.”
— Biotech Farm Scientific Advisory
Defining Effect Size: How to Choose a Meaningful Biological Effect
The effect size is the magnitude of change or difference the study is designed to detect. The right anchor is biological or therapeutic relevance: what change in tumor volume, cardiac output, or biomarker level would matter for translation to the clinic?
Smaller effect sizes always require larger N, and this relationship is non-linear. The temptation to pick the smallest possible effect to “not miss anything” leads to unfeasibly large studies.
Professional Approaches to Defining the Minimum Detectable Effect (MDE)
- Tie MDE to mechanism of action and translational goal — not to statistical convenience.
- Use prior literature cautiously — published effects are often inflated due to publication bias.
- Seek expert consensus among biologists, veterinarians, and statisticians to calibrate what magnitude of change is clinically meaningful.
- Interpret MDE relative to expected variability — never in isolation.
Estimating Variability (SD) Without Pilot Data or Prior Information
Estimating standard deviation is often the hardest input to secure. When uncertainty remains, a sensitivity analysis — recomputing N across a plausible range of SD values — reveals how fragile or robust the sample size estimate really is.
Extract SD from previous experiments in the same laboratory using comparable models and procedures.
Extract SD values from published studies using comparable models, applying cautious interpretation.
A small pilot with the explicit purpose of estimating variability (not detecting effects) is the gold standard.
Reducing variability at the design level — genetic homogeneity of animals, tight environmental control, standardized procedures, and blinding — directly improves power and can reduce the required N. This is where Biotech Farm’s controlled large-animal housing delivers measurable statistical benefit.
Is “n=6 per Group” Always Sufficient for Animal Studies?
The habitual reliance on “n=6” is one of the most persistent myths in preclinical design. There is no universal N. Adequacy depends on the outcome’s variability, the biological effect being probed, and the experimental design.
Low-variability models with large, well-established biological effects. Each case still requires formal verification — not assumption.
Noisy models with subtle, clinically relevant effects. Arbitrary defaults lead to missed effects and wasted animal lives.
For methods to determine an evidence-based n, see this reference on calculating sample size for animal studies, which supports the justification of any group size animal study.
Comparing the Two Main Approaches to Sample Size Determination

| Feature | Power Analysis | Resource Equation |
|---|---|---|
| Required Inputs | Effect size, SD, α, power | Number of groups, target Error DF |
| Best Use Case | Confirmatory studies with prior data | Exploratory or pilot studies |
| Output | Specific n per group | Total N range yielding E = 10–20 |
| Limitation | Sensitive to input accuracy | Not tied to a specific effect |
| Regulatory Acceptance | ✓ Widely accepted | ✓ Accepted when justified |
Calculating Sample Size for Two-Group Comparisons
For two independent groups, define the outcome type (continuous or binary), specify α and target power, provide the effect size and SD for continuous outcomes, then choose the matching test. Dedicated software such as G*Power or R packages implements these formulas transparently — but the numbers are only as reliable as the inputs.
Test Selection by Outcome Type
- Continuous outcomes (normal distribution): Independent t-test
- Binary outcomes (proportions): Chi-square or Fisher’s Exact test
- Non-normal continuous data: Mann-Whitney (requires modestly larger N for equivalent power)
- Complex non-normality: Simulation-based sample size estimation
Sample Size Calculation for More Than Two Groups (ANOVA Designs)
Multi-group designs introduce complexity beyond pairwise comparisons. In ANOVA, the researcher must decide whether the primary goal is detecting an overall difference among groups (via the F-test) or specific pairwise/subset contrasts. Pre-specifying planned contrasts controls Type I error and prevents inflated N caused by unplanned multiple testing.
Post-hoc multiple comparison corrections (Bonferroni, Tukey) also affect the required sample size and must be incorporated into the calculation before the experiment begins — not after data are collected.
Handling Repeated Measures in Sample Size Determination
When each animal is measured multiple times, observations are correlated. This intra-subject correlation must be modeled explicitly using mixed-effects models or repeated measures ANOVA. Correctly designed repeated-measures studies can be highly efficient: each animal serves partially as its own control, which may reduce the total animal number calculation compared to independent-group designs of equivalent power.
Avoiding the Pitfall of Pseudoreplication in Repeated Measures
A frequent and consequential error is counting each time point as an independent observation. This is pseudoreplication, and it artificially inflates the apparent n and statistical significance. The animal (or the true experimental unit) remains the unit of analysis, regardless of how many measurements are collected per subject.
The Importance of the “Experimental Unit” for Accurate Animal Numbers
The experimental unit is the smallest entity that is independently assigned to a treatment. If the treatment is applied to drinking water shared by a cage, the cage — not each mouse — is the experimental unit. Misidentifying the experimental unit is the single most common source of invalid sample size calculation preclinical study, producing misleadingly small p-values and overstated confidence.
Well-designed preclinical protocols benefit from integrated imaging and longitudinal readouts. Preclinical imaging services support in-vivo repeated measurements that, when correctly analyzed, help align statistical planning with the true experimental unit.
Common Experimental Unit Examples in Large Animal Research
| Study Scenario | Experimental Unit |
|---|---|
| Drug administered via individual injection | Individual animal |
| Treatment in shared cage water/feed | The cage (not each animal) |
| Multiple biopsy sites per single animal | The animal (not each biopsy) |
| Litter-derived animals, litter not randomized | The litter (not individual pups) |
The Resource Equation Approach for Sample Size Planning
The Resource Equation, promoted by Festing and colleagues, provides an alternative when power analysis inputs are unavailable. It targets an adequate number of degrees of freedom for the error term (E) in ANOVA models, with a widely accepted range of 10 to 20. Below 10, the study is generally underpowered; above 20, additional animals contribute diminishing statistical returns.
This approach is especially useful in pilot and exploratory preclinical studies, as discussed in the methodological literature at PMC on the Resource Equation approach.
Calculating Error Degrees of Freedom (E) Intuitively
4 groups × 6 animals = 24 total; E = 24 − 4 = 20. At the upper end of recommended range.
4 groups × 4 animals = 16 total; E = 16 − 4 = 12. Still within the acceptable range of 10–20.
4 groups × 3 animals = 12 total; E = 12 − 4 = 8. Below the acceptable threshold of 10.
Power Analysis vs. Resource Equation: When to Use Which?
Power analysis is optimal when reliable estimates of effect size and variability exist and the goal is to detect a specific, biologically defined effect. The Resource Equation is preferred for exploratory or pilot preclinical designs where prior data are scarce. A combined approach — using the Resource Equation to set an initial group size animal study, then applying power analysis to identify the detectable effect at that N — is often the most transparent solution.
Comprehensive planning support for such designs is available through the Biotech Farm preclinical research team.
Business Needs Meet Preclinical Planning: Where Biotech Farm Adds Value
The 3Rs are both an ethical mandate and a regulatory requirement. Detailed reporting on animal use is publicly documented by national bodies such as the Israeli animal experimentation authority in this official statistics collection, reinforcing the expectation that 3Rs animal numbers be justified transparently.
| Research Need | How the Biotech Farm Environment Supports It |
|---|---|
| Statistical justification of N | Scientific escort integrated into protocol design from day one |
| Reducing biological variability | Controlled large-animal housing and standardized procedures |
| Longitudinal, repeated measurements | In-vivo imaging suite (fluoroscopy, ultrasound, echocardiography) |
| 3Rs compliance documentation | Well-documented procedures and transparency in collaboration |
| GLP-aligned execution | State-of-the-art facility with experienced professional crew |
Justifying Animal Numbers in Ethical Protocols (IACUC/Institutional Approval)
Ethics committees expect a detailed, reproducible rationale for the chosen N. A defensible submission includes all elements below. Studies executed at Biotech Farm benefit from documentation practices that align with these regulatory expectations from the outset.
Clear statement of study objectives and primary outcome measure.
Chosen method (power analysis or Resource Equation) with all input parameters (α, power, effect size, SD, experimental unit).
Explanation of how the 3Rs shaped the design, plus a contingency plan for expected attrition.
“Rigorous sample size calculation preclinical study documentation is not a formality — it is the foundation of scientific credibility and animal welfare. Ethics committees are increasingly sophisticated in detecting post-hoc rationalization versus genuine pre-study planning.”
— Biotech Farm Protocol Design Team
Practical Challenges, Common Pitfalls, and Tools
- Underestimating SD (most common cause of underpowered studies)
- Choosing unrealistic or inflated effect sizes
- Pseudoreplication — misidentifying the experimental unit
- No pilot data to anchor variability assumptions
- Failure to correct for multiple comparisons
- G*Power — dedicated power analysis application, widely used
- R (pwr, simr packages) — flexible, handles complex designs
- SAS / SPSS — enterprise-level statistical environments
- Online calculators — convenient for simple two-group t-tests
- Simulation-based estimation — increasingly practical for complex non-normal designs
Software cannot compensate for poor inputs: understanding the assumptions behind each parameter is more important than the interface used to enter them. A short methodological review with a statistician before protocol submission resolves the majority of these issues. Critical caveat: tools are only as reliable as the biological knowledge informing them.
Frequently Asked Questions
Planning Your Next Preclinical Study?
Is your protocol built on a sample size that will withstand both statistical and ethical review? Rigorous sample size calculation is not a formality — it is the foundation of scientific credibility and animal welfare. For scientifically supportive planning of your large-animal preclinical research, including experimental design, group size justification, and 3Rs-aligned execution, connect with the team at Biotech Farm.